Executive Summary
Haverty Furniture Companies, Inc. operates as a specialty retailer of residential furniture and accessories in the United States. The company offers furniture merchandise under the Havertys brand name. It also provides custom upholstery products; and mattress product lines under the Sealy, Tempur-Pedic, Serta, Stearns & Foster, Beautyrest Black, and Scott Living names, as well as private label Skye name. The company sells home furnishings through its retail stores, as well as through its Website. As of April 01, 2020, it operated 120 showrooms in 16 states in the Southern and Midwestern regions. Haverty Furniture Companies, Inc. was founded in 1885 and is headquartered in Atlanta, Georgia.
STRENGTHS
WEAKNESSES
SIMILAR COMPANIES
TICKER: HOME
TICKER: RH
TICKER: W
1.2Stores & Square Footage
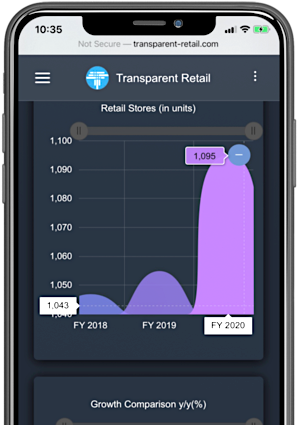
1.2.1Retail Stores (in units)
120 Stores
Retail Stores
1 Stores
Growth y/y (in units)
0.83%
Growth y/y (%)
| Company - Retail Stores |
Furniture & Home - Retail Stores |
|
|---|---|---|
| Annual Growth (%) | -0.8% | -1.8% |
| 3-Year CAGR (%) | -0.8% | 0.1% |
| Quarter Growth (%) | - | - |
| Top Furniture & Home Companies by Retail Stores - Retail Stores & Growth y/y (%) |
|
|---|---|
| Rent-A-Center, Inc. Growth y/y (%) | 1,966 -36.46% |
| Bed Bath & Beyond Inc. Growth y/y (%) | 1,500 -2.15% |
| Aaron's, Inc. Growth y/y (%) | 1,092 -6.43% |
| Top Furniture & Home Companies by % △ in Retail Stores - Retail Stores & Growth y/y (%) |
|
|---|---|
| Conn's, Inc. Growth y/y (%) | 137.00 11.38% |
| Floor & Decor Holdings, Inc. Growth y/y (%) | 133.00 10.83% |
| At Home Group Inc. Growth y/y (%) | 219.00 3.30% |
- Retail Stores: At the end of FY 2020, HVT operated 120 retail stores, a decline of 0.83% YoY.
1.2.2Gross Sq. Ft.(in Million)
4.35 Sq. Ft.
Gross Sq. Ft. (in million)
0.07 Sq. Ft.
Growth y/y (in million)
1.67%
Growth y/y (%)
| Company - Gross Sq. Ft. |
Furniture & Home - Gross Sq. Ft. |
|
|---|---|---|
| Annual Growth (%) | -1.7% | -1.7% |
| 3-Year CAGR (%) | -0.7% | 0.8% |
| Quarter Growth (%) | - | - |
| Top Furniture & Home Companies by Gross Sq. Ft. - Gross Sq. Ft. & Growth y/y (%) |
|
|---|---|
| Bed Bath & Beyond Inc. Growth y/y (%) | 42.26mn -2.02% |
| At Home Group Inc. Growth y/y (%) | 23.00mn 3.30% |
| Floor & Decor Holdings, Inc. Growth y/y (%) | 10.37mn 13.75% |
| Top Furniture & Home Companies by % △ in Gross Sq. Ft. - Gross Sq. Ft. & Growth y/y (%) |
|
|---|---|
| Floor & Decor Holdings, Inc. Growth y/y (%) | 10.37mn 13.75% |
| Conn's, Inc. Growth y/y (%) | 4.98mn 12.49% |
| At Home Group Inc. Growth y/y (%) | 23.00mn 3.30% |
- Gross Sq.Ft.: At the end of FY 2020, gross absorption of company-operated retail stores decreased by 1.67% YoY to 4.35 million sq.ft.
1.2.3Average Store Size (in Sq. Ft.)
36266.67 Sq. Ft.
Average Sq. Ft. (in units)
311.85 Sq. Ft.
Growth y/y (in units)
0.14 Sq. Ft.
Furniture & Home: Growth y/y (in units)
| Company - Avg. Sq. Ft. |
Furniture & Home - Average Sq. Ft. |
|
|---|---|---|
| Annual Growth (%) | -0.9% | 0.1% |
| 3-Year CAGR (%) | 0.3% | 0.3% |
| Quarter Growth (%) | - | - |
| Top Furniture & Home Companies by Average Sq. Ft. - Average Sq. Ft. & Growth y/y (%) |
|
|---|---|
| At Home Group Inc. Growth y/y (%) | 105,000 0.00% |
| Floor & Decor Holdings, Inc. Growth y/y (%) | 78,000 2.63% |
| Conn's, Inc. Growth y/y (%) | 36,337 0.99% |
| Top Furniture & Home Companies by % △ in Avg. Sq. Ft. - Average Sq. Ft. & Growth y/y (%) |
|
|---|---|
| RH Growth y/y (%) | 13,120 3.61% |
| Floor & Decor Holdings, Inc. Growth y/y (%) | 78,000 2.63% |
| Williams-Sonoma, Inc. Growth y/y (%) | 6,725 2.39% |
- Average Store Size: In FY 2020, the average store size of company-operated retail stores reduced by 0.85% YoY to 36266.7 sq.ft.
1.3Store Efficiency
1.3.1Sales per Sq. Ft.(in USD)
$164.37
Sales per Sq. Ft.
7.09%
Growth y/y (%)
6.29%
Furniture & Home: Growth y/y (%)
| Company - Sales per Sq. Ft. |
Furniture & Home - Sales per Sq. Ft. |
|
|---|---|---|
| Annual Growth (%) | -7.1% | -6.3% |
| 3-Year CAGR (%) | -1.1% | -1.1% |
| Quarter Growth (%) | - | - |
| Sales per Sq.ft-TTM Growth (%) | - - | - - |
| Sales per Sq.ft-YTMRQ Growth (%) | - - | - - |
| Top Furniture & Home Companies by Sales per Sq. Ft. - Sales per Sq. Ft. & Growth y/y (%) |
|
|---|---|
| RH Growth y/y (%) | $2,431 88.70% |
| Williams-Sonoma, Inc. Growth y/y (%) | $1,362 138.84% |
| Sleep Number Corp. Growth y/y (%) | $897.99 0.77% |
| Top Furniture & Home Companies by % △ in Sales per Sq. Ft. - Sales per Sq. Ft. & Growth y/y (%) |
|
|---|---|
| Williams-Sonoma, Inc. Growth y/y (%) | $1,362 138.84% |
| RH Growth y/y (%) | $2,431 88.70% |
| Rent-A-Center, Inc. Growth y/y (%) | $287.61 64.02% |
- Sales per Sq.Ft.: In FY 2020, the Company's retail sales per sq.ft. fell by 7.09% YoY to $164.37 per sq.ft.
1.3.2Sales per Store (in Million USD)
$5.96 Mn
Sales per Store
7.89%
Growth y/y (%)
4.13%
Furniture & Home: Growth y/y (%)
| Company - Sales per Store |
Furniture & Home - Sales per Store |
|
|---|---|---|
| Annual Growth (%) | -7.9% | -4.1% |
| 3-Year CAGR (%) | -0.5% | -0.5% |
| Quarter Growth (%) | - | - |
| Sales per Store-TTM Growth (%) | - - | - - |
| Sales per Store-YTMRQ Growth (%) | - - | - - |
| Top Furniture & Home Companies by Sales per Store - Sales per Store & Growth y/y (%) |
|
|---|---|
| RH Growth y/y (%) | $31.90Mn 95.52% |
| Floor & Decor Holdings, Inc. Growth y/y (%) | $14.68Mn -3.82% |
| Williams-Sonoma, Inc. Growth y/y (%) | $9.16Mn 144.54% |
| Top Furniture & Home Companies by % △ in Sales per Store - Sales per Store & Growth y/y (%) |
|
|---|---|
| Williams-Sonoma, Inc. Growth y/y (%) | $9.16Mn 144.54% |
| RH Growth y/y (%) | $31.90Mn 95.52% |
| Rent-A-Center, Inc. Growth y/y (%) | $1.38Mn 64.02% |
- Sales per Store: In FY 2020, the Company's retail sales per store fell by 7.89% YoY to $5.96 million.
1.4Stores By Region
- US Stores: The Company ended FY 2020 with 120 company-operated stores in the U.S., a decline of 0.83% YoY.
1.5Stores By Ownership (in units)
38 Stores
Company Owned Stores (in units)
82 Stores
Leased Stores (in units)
31.67%
Company Owned Stores (%)
| Company - Owned Stores |
Furniture & Home - Owned Stores |
Company - Leased Stores |
Furniture & Home - Leased Stores |
|
|---|---|---|---|---|
| Annual Growth (%) | -2.6% | 0% | 0% | 3.28% |
| 3-Year CAGR (%) | -3.2% | 0% | 0.4% | 0.1% |
| As a % of Total Stores | 31.7% | 31.7% | 68.3% | 68.3% |
| Quarter Growth (%) | - | - | - | - |
| Top Furniture & Home Companies by Owned Stores (%) - Owned Stores & Owned Stores (%) |
|
|---|---|
| La-Z-Boy Inc. Owned Stores (%) | 154.00 43.50% |
| Ethan Allen Interiors Inc. Owned Stores (%) | 51.00 35.42% |
| Haverty Furniture Companies, Inc. Owned Stores (%) | 38.00 31.67% |
| Top Furniture & Home Companies by Leased Stores (%) - Leased Stores & Leased Stores (%) |
|
|---|---|
| Bed Bath & Beyond Inc. Leased Stores (%) | 1,500 100.00% |
| Conn's, Inc. Leased Stores (%) | 137.00 100.00% |
| Williams-Sonoma, Inc. Leased Stores (%) | 614.00 100.00% |
- Comment: At the end of FY 2020,68.33% of the Company's total retail stores were leased, while the rest were company-owned stores.
1.6Same Store Sales (%)
1.6.1Same Store Sales
5%
Growth y/y (%)
1.4%
Growth y/y (%) – last year
2.9%
Furniture & Home - Growth y/y (%)
| Top Furniture & Home Companies by Same Store Sales (%) | HOME | RCII | SNBR | Same Store Sales (%) | 19.4% | 13.7% | 6% |
|---|---|---|---|
| Same Store Sales (%) – Last Year | -1.7% | 4.6% | 6% |
- Same Store Sales: HVT's same store sales increased by 5% in FY 2020, compared to a 5% increase in 802.29.
1.7Brand Efficiency
1.7.1Sales By Brand (in $ Mn)
1.7.2Stores by Brand(in Units)
1.7.3Square Feet by Brand(in Million)
1.7.4Average Store Size by Brand (in Sq.ft.)
1.7.5Sales per Store by Brand (in million USD)
1.7.6Sales per SQFT by Brand (in USD)
1.8Stores & Sq. Ft. By Brand & Region
1.8.1Stores by Brand & Region
1.8.2Sq. Ft. By Brand & Region
2Financial Analysis
Analysis of HVT's financial ratios.
2.1Margins & Returns (%)
2.1.1Gross Margin (%)
The ratio of a company's gross margin to its revenue. Gross Margin = Gross Profit Total Revenue (in %)
| The ratio of a company's gross margin to its revenue. | |
| Gross Margin = | Gross Profit |
| Total Revenue (in %) | |
56%
Gross Margin (%)
54.16%
Gross Margin (%) – Last Year
42.5%
Furniture & Home: Gross Margin (%)
| Company - Gross Margin |
Furniture & Home - Gross Margin |
|
|---|---|---|
| Annual Growth (%) | 3.4% | 0% |
| 3-Year CAGR (%) | 0.1% | 0% |
| Quarter Growth (%) | - | - |
| G Margin (%)-TTM Growth (%) | - - | - - |
| G Margin (%)-YTMRQ Growth (%) | - - | - - |
| Top Furniture & Home Companies by Gross Margin - Gross Margin (%) & Growth y/y (%) |
|
|---|---|
| Aaron's, Inc. Growth y/y (%) | 62.45% -35.30% |
| Sleep Number Corp. Growth y/y (%) | 62.27% 0.53% |
| Rent-A-Center, Inc. Growth y/y (%) | 59.42% -3.51% |
| Top Furniture & Home Companies by % △ in Gross Margin - Gross Margin (%) & Growth y/y (%) |
|
|---|---|
| Wayfair Inc. Growth y/y (%) | 29.07% 23.56% |
| At Home Group Inc. Growth y/y (%) | 34.63% 21.86% |
| Kirkland's, Inc. Growth y/y (%) | 31.80% 16.08% |
- Gross Margin (%): HVT generated a gross margin of 56% in FY 2020, higher than its peer group's median (42.5%).
- Growth YoY(%): Achieved a margin growth of 3.4% YoY in FY 2020, exceeding its peer group's median (-1.27%).
2.1.2EBITDA MARGIN (%)
A profitability ratio that measures how much in earnings a company is generating before interest, taxes, depreciation, and amortization, as a percentage of revenue. EBITDA Margin = EBITDA(Earnings Before Interest, Tax, Depreciation & Ammortiazation) Total Revenue
| A profitability ratio that measures how much in earnings a company is generating before interest, taxes, depreciation, and amortization, as a percentage of revenue. | |
| EBITDA Margin = | EBITDA(Earnings Before Interest, Tax, Depreciation & Ammortiazation) |
| Total Revenue | |
12.67%
EBITDA Margin (%)
5.99%
EBITDA Margin (%) – Last Year
7.3%
Furniture & Home: EBITDA Margin (%)
| Company - EBITDA Margin |
Furniture & Home - EBITDA Margin |
|
|---|---|---|
| Annual Growth (%) | 111.6% | -6.9% |
| 3-Year CAGR (%) | -13.9% | -2.2% |
| Quarter Growth (%) | - | - |
| EBITDA (%) –TTM Growth (%) | - - | - - |
| EBITDA (%) –YTMRQ Growth (%) | - - | - - |
| Top Furniture & Home Companies by EBITDA Margin - EBITDA Margin (%) & Growth y/y (%) |
|
|---|---|
| RH Growth y/y (%) | 17.51% 20.67% |
| Sleep Number Corp. Growth y/y (%) | 13.28% 29.60% |
| Haverty Furniture Companies, Inc. Growth y/y (%) | 12.67% 111.64% |
| Top Furniture & Home Companies by % △ in EBITDA Margin - EBITDA Margin (%) & Growth y/y (%) |
|
|---|---|
| Kirkland's, Inc. Growth y/y (%) | 5.80% 238.41% |
| Wayfair Inc. Growth y/y (%) | 4.57% 156.52% |
| Haverty Furniture Companies, Inc. Growth y/y (%) | 12.67% 111.64% |
- EBITDA Margin (%): HVT generated an EBITDA margin of 12.67% in FY 2020, higher than its peer group's median (7.07%).
- Growth YoY(%): Achieved a margin growth of 111.64% YoY in FY 2020, exceeding its peer group's median (-11.14%).
2.1.3Operating Margin (%)
A profitability ratio that measures how much in earnings a company is generating before interest, taxes, depreciation, and amortization, as a percentage of revenue. Operating Margin = Operation Income or EBIT (Earning Before Income & Tax) Total Revenue
| A profitability ratio that measures how much in earnings a company is generating before interest, taxes, depreciation, and amortization, as a percentage of revenue. | |
| Operating Margin = | Operation Income or EBIT (Earning Before Income & Tax) |
| Total Revenue | |
10.24%
EBIT Margin (%)
3.42%
EBIT Margin (%) – Last Year
3.61%
Furniture & Home: EBIT Margin (%)
| Company - EBIT Margin |
Furniture & Home - EBIT Margin |
|
|---|---|---|
| Annual Growth (%) | 199.4% | -8.7% |
| 3-Year CAGR (%) | -16.3% | -3.6% |
| Quarter Growth (%) | - | - |
| EBIT (%) –TTM Growth (%) | - - | - - |
| EBIT (%) –YTMRQ Growth (%) | - - | - - |
| Top Furniture & Home Companies by EBIT Margin - EBIT Margin (%) & Growth y/y (%) |
|
|---|---|
| RH Growth y/y (%) | 13.70% 18.73% |
| Haverty Furniture Companies, Inc. Growth y/y (%) | 10.24% 199.37% |
| Sleep Number Corp. Growth y/y (%) | 9.96% 50.89% |
| Top Furniture & Home Companies by % △ in EBIT Margin - EBIT Margin (%) & Growth y/y (%) |
|
|---|---|
| Haverty Furniture Companies, Inc. Growth y/y (%) | 10.24% 199.37% |
| Wayfair Inc. Growth y/y (%) | 2.55% 125.00% |
| Kirkland's, Inc. Growth y/y (%) | 1.52% 117.36% |
- Operating Margin (%): HVT generated an operating margin of 10.24% in FY 2020, higher than its peer group's median (3.61%).
- Growth YoY(%): Achieved a margin growth of 199.37% YoY in FY 2020, exceeding its peer group's median (-17.43%).
2.1.4Net Margin (%)
The ratio of a company's net profit to its revenue. Net Margin = Net Profit or Profit After Tax (PAT) Total Revenue
| The ratio of a company's net profit to its revenue. | |
| Net Margin = | Net Profit or Profit After Tax (PAT) |
| Total Revenue | |
7.9%
PAT Margin (%)
2.73%
PAT Margin (%) – Last Year
2.32%
Furniture & Home: PAT Margin (%)
| Company - PAT Margin |
Furniture & Home - PAT Margin |
|
|---|---|---|
| Annual Growth (%) | 190.1% | 5.9% |
| 3-Year CAGR (%) | -8.3% | -2% |
| Quarter Growth (%) | - | - |
| PAT (%) – TTM Growth (%) | - - | - - |
| PAT (%) – YTMRQ Growth (%) | - - | - - |
| Top Furniture & Home Companies by PAT Margin - PAT Margin (%) & Growth y/y (%) |
|
|---|---|
| RH Growth y/y (%) | 8.32% 38.46% |
| Floor & Decor Holdings, Inc. Growth y/y (%) | 8.04% 9.15% |
| Haverty Furniture Companies, Inc. Growth y/y (%) | 7.90% 190.05% |
| Top Furniture & Home Companies by % △ in PAT Margin - PAT Margin (%) & Growth y/y (%) |
|
|---|---|
| Haverty Furniture Companies, Inc. Growth y/y (%) | 7.90% 190.05% |
| Kirkland's, Inc. Growth y/y (%) | 3.06% 134.71% |
| Wayfair Inc. Growth y/y (%) | 1.31% 112.12% |
- Net Margin (%): HVT generated a net margin of 7.9% in FY 2020, higher than its peer group's median (1.55%).
- Growth YoY(%): Achieved a margin growth of 190.05% YoY in FY 2020, exceeding its peer group's median (-29.28%).
2.1.5Return on Investment (%)
ROI (Return on Investment) is a profitability measure which shows how efficiently Company's management is using its assets to generate profits. ROI = Net Income Total Assets
| ROI (Return on Investment) is a profitability measure which shows how efficiently Company's management is using its assets to generate profits. | |
| ROI = | Net Income |
| Total Assets | |
8.69%
ROI (%)
3.9%
ROI (%) – Last Year
3.32%
Furniture & Home: ROI (%)
| Company - ROI (%) |
Furniture & Home - ROI (%) |
|
|---|---|---|
| Annual Growth (%) | 122.7% | -22.2% |
| 3-Year CAGR (%) | -14.3% | -12.6% |
| Quarter Growth (%) | - | - |
| Top Furniture & Home Companies by ROI - Return on Investment (%) & Growth y/y (%) |
|
|---|---|
| Sleep Number Corp. Growth y/y (%) | 17.40% 71.32% |
| Rent-A-Center, Inc. Growth y/y (%) | 11.89% 8.40% |
| RH Growth y/y (%) | 9.01% 8.03% |
| Top Furniture & Home Companies by % △ in ROI - Return on Investment (%) & Growth y/y (%) |
|
|---|---|
| Sleep Number Corp. Growth y/y (%) | 17.40% 71.32% |
| Rent-A-Center, Inc. Growth y/y (%) | 11.89% 8.40% |
| RH Growth y/y (%) | 9.01% 8.03% |
- Return on Investment (%): HVT generated a return on investment of 8.69% in FY 2020, higher than its peer group's median (2.01%).
- Growth YoY(%): Achieved a return on investment growth of 122.68% YoY in FY 2020, exceeding its peer group's median (-45.61%).
2.1.6Return on Equity (%)
ROE (Return on Equity) is a profitability measure which shows how efficiently a Company's management team has used its shareholder money to generate profits. ROE = Net Income Total Shareholders Equity
| ROE (Return on Equity) is a profitability measure which shows how efficiently a Company's management team has used its shareholder money to generate profits. | |
| ROE = | Net Income |
| Total Shareholders Equity | |
23.38%
ROE (%)
8.39%
ROE (%) – Last Year
7.13%
Furniture & Home: ROE (%)
| Company - ROE (%) |
Furniture & Home - ROE (%) |
|
|---|---|---|
| Annual Growth (%) | 178.6% | -25% |
| 3-Year CAGR (%) | -6% | -6.75% |
| Quarter Growth (%) | - | - |
| Top Furniture & Home Companies by ROE - Return on Equity (%) & Growth y/y (%) |
|
|---|---|
| RH Growth y/y (%) | 1,182% 0.00% |
| Rent-A-Center, Inc. Growth y/y (%) | 35.15% -7.04% |
| Williams-Sonoma, Inc. Growth y/y (%) | 28.81% -0.21% |
| Top Furniture & Home Companies by % △ in ROE - Return on Equity (%) & Growth y/y (%) |
|
|---|---|
| Haverty Furniture Companies, Inc. Growth y/y (%) | 23.38% 178.57% |
| Kirkland's, Inc. Growth y/y (%) | 17.53% 125.33% |
| At Home Group Inc. Growth y/y (%) | -30.93% 12.23% |
- Return on Equity (%): HVT generated a return on equity of 23.38% in FY 2020, higher than its peer group's median (4.02%).
- Growth YoY(%): Achieved a return on equity growth of 178.57% YoY in FY 2020, exceeding its peer group's median (-61.58%).
2.2Liquidity Ratio (X)
2.2.1CURRENT RATIO (X)
The most common liquidity metric which measures the capability of the business to meet its short-term obligations that are due within a year. Current Ratio = Current Assets Current Liabilities (in times)
| The most common liquidity metric which measures the capability of the business to meet its short-term obligations that are due within a year. | |
| Current Ratio = | Current Assets |
| Current Liabilities (in times) | |
1.55x
Current Ratio (X)
1.61x
Current Ratio (X) – Last Year
1.52x
Furniture & Home: Current Ratio (X)
| Top Furniture & Home Companies by optimally maintaining the Current Ratio | CONN | TUES | RCII | Current Ratio(X) | 6.53x | 4.43x | 1.98x |
|---|---|---|---|
| Current Ratio(X) – Last Year | 4.27x | 1.87x | 1.86x |
- Current Ratio: HVT's current ratio (1.55x) was within the industry optimal range, indicating an ability to cover all of its short-term obligations.
A Current Ratio between 1.5 times to 3.0 times is considered optimal.
2.2.2QUICK RATIO (X)
The ratio measures the ability of the business to pay its short-term liabilities with assets readily covertible into cash. Quick Ratio = (Total Current Assets-Inventories) Total Current Liabilities (in times)
| The ratio measures the ability of the business to pay its short-term liabilities with assets readily covertible into cash. | |
| Quick Ratio = | (Total Current Assets-Inventories) |
| Total Current Liabilities (in times) | |
1.11x
Quick Ratio (X)
0.78x
Quick Ratio (X) – Last Year
0.65x
Furniture & Home: Quick Ratio (X)
| Top Furniture & Home Companies by optimally maintaining the Quick Ratio | CONN | TUES | W | Quick Ratio(X) | 5.17x | 1.52x | 1.38x |
|---|---|---|---|
| Quick Ratio(X) – Last Year | 3.34x | 0.14x | 0.82x |
- Quick Ratio: HVT's quick ratio (1.11x) was within the industry optimal range, indicating that it has enough liquid assets to instantly pay off its current liabilities.
A Quick Ratio between 1.0 times to 2.0 times is considered optimal.
2.2.3CASH RATIO (X)
A ratio that indicates Company's capacity to pay-off short term debt obligatons with its cash and cash equivalents. Cash Ratio = Cash and Cash Equivalents Total Current Liabilities (in times)
| A ratio that indicates Company's capacity to pay-off short term debt obligatons with its cash and cash equivalents. | |
| Cash Ratio = | Cash and Cash Equivalents |
| Total Current Liabilities (in times) | |
0.98x
Cash Ratio (X)
0.6x
Cash Ratio (X) – Last Year
0.36x
Furniture & Home: Cash Ratio (X)
| Top Furniture & Home Companies by optimally maintaining the Cash Ratio | TUES | W | HVT | Cash Ratio(X) | 1.18x | 0.98x | 0.98x |
|---|---|---|---|
| Cash Ratio(X) – Last Year | 0.08x | 0.36x | 0.6x |
- Cash Ratio: HVT demonstrates abilityto pay off its short-term liabilities to a large extent, using its cash reserves.
We consider companies with ratio between 0.5 times to 1.0 times to be optimal.
2.3Stability Ratio (X)
2.3.1FIXED ASSET RATIO (X)
The ratio measures the amount of fixed assets being financed by each unit of long term funds. Fixed Asset Ratio = Fixed Assets Long Term Funds
| The ratio measures the amount of fixed assets being financed by each unit of long term funds. | |
| Fixed Asset Ratio = | Fixed Assets |
| Long Term Funds | |
0.43x
Fixed Asset Ratio (X)
0.6x
Fixed Asset Ratio (X) – Last Year
0.46x
Furniture & Home: Fixed Asset Ratio (X)
| Top Furniture & Home Companies by Fixed Asset Ratio | TUES | RH | HOME | Fixed Asset Ratio(X) | 9.9x | 1.66x | 0.86x |
|---|---|---|---|
| Fixed Asset Ratio(X) – Last Year | 0.54x | 1.08x | 0.76x |
- Negative: A lower fixed asset ratio of 0.27x compared to the industry average of 3.0x indicates company might face difficulty in paying off its debt using fixed assets in case of bankruptcy.
2.3.2CURRENT ASSET TO FIXED ASSET RATIO (X)
The ratio measures the amount of money tied up by the company in current asset & fixed assets. Current Ratio to Fixed Asset Ratio = Current Asset Fixed Assets
| The ratio measures the amount of money tied up by the company in current asset & fixed assets. | |
| Current Ratio to Fixed Asset Ratio = | Current Asset |
| Fixed Assets | |
2.92x
CA / FA (X)
1.31x
CA / FA (X) – Last Year
2.61x
Furniture & Home: CA / FA Ratio (X)
| Top Furniture & Home Companies by Current Asset to Fixed Asset Ratio (x) | RCII | CONN | W | CA / FA Ratio (x) | 8.57x | 6.12x | 4.45x |
|---|---|---|---|
| CA / FA Ratio (x) – Last Year | 6.27x | 6.81x | 2.21x |
- Positive: The company has better current asset to fixed asset ratio of 1.77x compared to the industry average of 1.67x.
2.3.3Proprietary Ratio (X)
The ratio is an estimate of the amount of capitalization currently used to support a busniess. The higher ratio indicates that a company has sufficient amount of equity to support the functions of the business and can probably take on additional debt, if necessary. Proprietary Ratio = Total Shareholders Equity Total Assets (in times)
| The ratio is an estimate of the amount of capitalization currently used to support a busniess. The higher ratio indicates that a company has sufficient amount of equity to support the functions of the business and can probably take on additional debt, if necessary. | |
| Proprietary Ratio = | Total Shareholders Equity |
| Total Assets (in times) | |
0.37x
Proprietary Ratio (X)
0.47x
Proprietary Ratio (X) – Last Year
0.3x
Furniture & Home: Proprietary Ratio (X)
| Top Furniture & Home Companies by Proprietary Ratio (x) | ETH | AAN | LZB | Proprietary Ratio (x) | 0.53x | 0.53x | 0.5x |
|---|---|---|---|
| Proprietary Ratio (x) – Last Year | 0.71x | 0.53x | 0.66x |
- Proprietary Ratio: HVT's proprietary ratio (0.37x) is low, reflecting a high dependency on debts for its business operations.
We consider Proprietary Ratio below 0.45 times to be low.
- Peer Comparison: HVT's creditors appear to be more secured as compared to its peer group (0.3x).
2.4Financial Risk Ratio (X)
2.4.1Debt to Equity Ratio (X)
Measures how much a company is financing its operations through debt versus wholly-owned funds. The higher the ratio, the more debt a company uses to fund its operations. Debt to Equity Ratio = (Short Term Debt+Long Term Debt) Total Shareholders Equity
| Measures how much a company is financing its operations through debt versus wholly-owned funds. The higher the ratio, the more debt a company uses to fund its operations. | |
| Debt to Equity Ratio = | (Short Term Debt+Long Term Debt) |
| Total Shareholders Equity | |
-x
D / E Ratio (X)
-x
D / E Ratio (X) – Last Year
0.49x
Furniture & Home: D / E Ratio (X)
| Top Furniture & Home Companies by Debt to Equity Ratio (x) | LZB | ETH | FND | D / E Ratio (x) | 0.1x | 0.15x | 0.21x |
|---|---|---|---|
| D / E Ratio (x) – Last Year | 0x | 0x | 0.19x |
- Comment: The Company had no interest-paying debt outstanding during the period.
2.4.2Interest Coverage Ratio (ICR)
Measures how many times a company can cover its current interest payment with its available earnings. The lower the ratio, the more a debt burden the company has. Interest Coverage Ratio = Operating Income (EBIT) Interest Expense
| Measures how many times a company can cover its current interest payment with its available earnings. The lower the ratio, the more a debt burden the company has. | |
| Interest Coverage Ratio = | Operating Income (EBIT) |
| Interest Expense | |
195.92x
Int. Coverage Ratio (X)
180.51x
Int. Coverage (X) – Last Year
18.1x
Furniture & Home: Int. Coverage Ratio (X)
| Top Furniture & Home Companies by Interest Coverage Ratio (x) | HVT | LZB | WSM | Int. Coverage Ratio (x) | 195.92x | 91.99x | 52.62x |
|---|---|---|---|
| Int. Coverage Ratio (x) – Last Year | 180.51x | 84.09x | 65.01x |
- Interest Coverage Ratio: During FY 2020, HVT generated enoughoperating income to pay its interest obligations with some extra earnings left over to make the principal repayments.
We consider ICR above 1.5 times to be satisfactory.
- Peer Comparison: Its ratio exceed peers' median (20.72x), reflecting its creditworthiness and ability to borrow new debt at relatively cheaper rate.
2.4.3Debt Coverage Ratio
The ratio measures the ability of a company to use its EBITDA to repay all debt obligations. Debt Coverage Ratio = EBITDA (Short Term Debt+Interest Expense)
| The ratio measures the ability of a company to use its EBITDA to repay all debt obligations. | |
| Debt Coverage Ratio = | EBITDA |
| (Short Term Debt+Interest Expense) | |
242.49x
Debt Coverage Ratio (X)
316.01x
Debt Coverage Ratio (X) – Last Year
3.56x
Furniture & Home: Debt Coverage Ratio (X)
| Top Furniture & Home Companies by Debt Coverage Ratio (x) | HVT | ETH | KIRK | Debt Coverage Ratio (x) | 242.49x | 69.24x | 55.24x |
|---|---|---|---|
| Debt Coverage Ratio (x) – Last Year | 316.01x | 71.45x | 0x |
- Debt Coverage Ratio: HVT's debt coverage ratio was at 242.49x in FY 2020, indicating that its cash flow was sufficient to cover both its current debt obligations and capital expenditure program.
- Peer Comparison: Its ratio exceed peers' median (2.87x), reflecting its creditworthiness and ability to borrow new debt at relatively cheaper rate.
2.5Conversion Cycle (in Days)
2.5.1Inventory Days
The average number of days that a company holds its inventory before selling it. Inventory Days = Inventories * 365 Cost of Goods Sold
| The average number of days that a company holds its inventory before selling it. | |
| Inventory Days = | Inventories * 365 |
| Cost of Goods Sold | |
100 Days
Inventory Days
104 Days
Inventory Days – Last Year
111 Days
Furniture & Home: Inventory Days
| Top Furniture & Home Companies by Inventory Days ( in Days) | W | SNBR | KIRK | Inventory Days | 2Days | 42Days | 61Days |
|---|---|---|---|
| Inventory Days – Last Year | 3Days | 49Days | 79Days |
- Inventory Days: HVT took shorter time (100 days) to turn its inventory into sales as compared to its peer group's median (110.91 days). This may indicate that its business is growing and the management is efficient in inventory management.
- Growth YoY(%): An improvement in inventory days suggest working capital efficiency and that inventory levels are being kept under control in relation to the level of sales. However, maintaining too low inventory levels may eventually result in inventory shortages as demand fluctuates.
2.5.2Receivable Days
Measures the average number of days a company takes to collect payment after making a sale. Receivable Days = Trade Accounts Receivable * 365 Total Revenue
| Measures the average number of days a company takes to collect payment after making a sale. | |
| Receivable Days = | Trade Accounts Receivable * 365 |
| Total Revenue | |
- Days
Receivable Days
1 Days
Receivable Days – Last Year
7 Days
Furniture & Home: Receivable Days
| Top Furniture & Home Companies by Receivable Days ( in Days) | W | PIR | ETH | Receivable Days | 3Days | 5Days | 5Days |
|---|---|---|---|
| Receivable Days – Last Year | 4Days | 4Days | 7Days |
2.5.3Payable Days
Measures the average number of days a company takes to pay off its bills. Payable Days = Trade Accounts Payable * 365 Cost of Goods Sold
| Measures the average number of days a company takes to pay off its bills. | |
| Payable Days = | Trade Accounts Payable * 365 |
| Cost of Goods Sold | |
35 Days
Payable Days
28 Days
Payable Days – Last Year
46 Days
Furniture & Home: Payable Days
| Top Furniture & Home Companies by Payable Days ( in Days) | FND | RH | RCII | Payable Days | 110Days | 78Days | 59Days |
|---|---|---|---|
| Payable Days – Last Year | 114Days | 44Days | 60Days |
- Payable Days: HVT paid its bills relatively quickly (35 days) as compared to its peer group's median (46 days). This may indicate that the Company might be getting more favorable early pay discounts than its peer group and thus it may continue to pay its bills early.
- Growth YoY(%): Increased from 28 days in FY 2019 to 35 days in FY 2020 indicating that the company is paying its suppliers SLOWER, and may be an indicator of worsening financial condition.
2.5.4Cash Conversion Cycle
Measures the length of time it takes for a company to convert inventory and accounts receivable to cash and pay bills. Coversion Cycle = Inventory Days+Receivable Days-Payable Days
| Measures the length of time it takes for a company to convert inventory and accounts receivable to cash and pay bills. | |
| Coversion Cycle = | Inventory Days+Receivable Days-Payable Days |
- Days
Cash Conversion Cycle
77 Days
Cash Conversion Cycle – Last Year
77 Days
Furniture & Home: Cash Conversion Cycle
| Top Furniture & Home Companies by Cash Conversion Cycle ( in Days) | W | SNBR | RH | Cash Conversion Cycle | -37Days | 1Days | 32Days |
|---|---|---|---|
| Cash Conversion Cycle – Last Year | -40Days | -23Days | 90Days |
2.6Revolving Credit (in Million USD)
2.6.1Total Line of Credit
Measures the length of time it takes for a company to convert inventory and accounts receivable to cash and pay bills.
| Measures the length of time it takes for a company to convert inventory and accounts receivable to cash and pay bills. |
$60 Mn
Total Line of Credit [LOC] (in $ Mn)
$0 Mn
Revolving Credit Borrowing [RCB] (in $ Mn)
$15.3 Mn
Revolver Available [RA] (in $ Mn)
| Company - Total LOC |
Furniture & Home - Total LOC |
Company - RCB |
Furniture & Home - RCB |
Company - RA |
Furniture & Home - RA |
|
|---|---|---|---|---|---|---|
| Annual Growth (%) | 0% | 0% | 0% | -100% | 0% | -0.6% |
| 3-Year CAGR (%) | 0% | 0% | - | -100% | 0% | 80.57% |
| Quarter Growth (%) | - | - | - | - | - | - |
- Total Line of Credit: At the end of FY 2020, HVT's total line of credit, under the "Revolving Credit Facility", remained unchanged YoY at $60 million.
- Revolver Available: At the end of FY 2020, HVT's revolver available, under the "Revolving Credit Facility", remained unchanged YoY at $0 million.
2.6.2Revolver Availability (%)
Revover Availability (%) = Revolver Available (in $ million) * 100 TLOC or Borrowing Base
| Revover Availability (%) = | Revolver Available (in $ million) * 100 |
| TLOC or Borrowing Base |
100%
Revolver Availability [RA] (%)
100%
Revolver Availability (%) – Last Year
72.53%
Furniture & Home: Revolver Availability (%)
| Company - RA (%) |
Furniture & Home - RA (%) |
|
|---|---|---|
| RA (%) | 100% | 72.53% |
| Change y/y (%) | 0% | -0.59% |
| Change q/q (%) | - | - |
| Top Furniture & Home Companies by RA (%) - Revolver Availability & Growth y/y (%) |
|
|---|---|
| Haverty Furniture Companies, Inc. Growth y/y (%) | 100.00% 0.00% |
| Bed Bath & Beyond Inc. Growth y/y (%) | 97.96% 5.93% |
| Williams-Sonoma, Inc. Growth y/y (%) | 96.73% -0.02% |
| Top Furniture & Home Companies by % △ in RA (%) - Revolver Availability & Growth y/y (%) |
|
|---|---|
| At Home Group Inc. Growth y/y (%) | 73.55% 107.43% |
| Conn's, Inc. Growth y/y (%) | 95.14% 62.31% |
| Rent-A-Center, Inc. Growth y/y (%) | 69.77% 24.44% |
2.6.3Total Liquidity (in Million USD)
Liquidity refers to the ease with which an asset can be readily converted into cash without affecting its market price.
| Liquidity refers to the ease with which an asset can be readily converted into cash without affecting its market price. |
$215.36 Mn
Total Liquidity (in $ Mn)
65.61%
Change y/y (%)
15.09%
Furniture & Home: Change y/y (%)
| Company - Total Liquidity |
Furniture & Home - Total Liquidity |
|
|---|---|---|
| Annual Growth (%) | 65.6% | 15.1% |
| 3-Year CAGR (%) | 5.4% | 4% |
| Quarter Growth (%) | - | - |
| Top Furniture & Home Companies by Total Liquidity - Total Liquidity (in $ Mn) & Change y/y (%) |
|
|---|---|
| Wayfair Inc. Growth y/y (%) | $2,272Mn 224.15% |
| Williams-Sonoma, Inc. Growth y/y (%) | $983.51Mn 10.46% |
| Floor & Decor Holdings, Inc. Growth y/y (%) | $686.47Mn 123.94% |
| Top Furniture & Home Companies by % △ in Total Liquidity - Total Liquidity (in $ Mn) & Change y/y (%) |
|
|---|---|
| Wayfair Inc. Growth y/y (%) | $2,272Mn 224.15% |
| At Home Group Inc. Growth y/y (%) | $438.44Mn 169.34% |
| Floor & Decor Holdings, Inc. Growth y/y (%) | $686.47Mn 123.94% |
- Total Liquidity: At the end of FY 2020, HVT's total liquidity, comprising of cash & cash equivalents and revolver availability under the "Revolving Credit Facility", increased by 65.61% YoY to $215.36million.
2.7Other Ratios
2.7.1Fixed Charge Coverage Ratio (FCCR)
The FCCR (Fixed Charge Coverage Ratio) shows how well a company's earnings cover its fixed charges, such as debt payments, interest expense and rental expenses. FCCR = (EBIT+Rent Expense) (Interest Expense+Rent Expense)
| The FCCR (Fixed Charge Coverage Ratio) shows how well a company's earnings cover its fixed charges, such as debt payments, interest expense and rental expenses. | |
| FCCR = | (EBIT+Rent Expense) |
| (Interest Expense+Rent Expense) | |
2.49x
Fixed Charge Coverage Ratio [FCCR] (x)
1.57x
FCCR (x) – Last Year
1.9x
Furniture & Home: FCCR (x)
| Top Furniture & Home Companies by Fixed Charge Coverage Ratio (x) | BBBY | SNBR | LZB | FCCR (x) | 3770.19x | 2.75x | 2.56x |
|---|---|---|---|
| FCCR (x) – Last Year | 1487.93x | 2.01x | 2.68x |
- Fixed Charge Coverage Ratio: HVT's fixed charge coverage ratio was at 2.49x in FY 2020, indicating that its cash flow was sufficient to cover its fixed payment obligations as well as capital expenditure plans.
- Peer Comparison: Its ratio exceed peers' median (1.9x), reflecting its creditworthiness and ability to borrow new debt at more favorable rates.
2.7.2Lease Adjusted Debt (in Million USD)
Lease Adjusted Debt refers to the total short term and Long term debt of the Company. Lease Adjusted Debt = Short Term Debt + Long Term Debt + Short Term Operating Lease + Long Term Operating Lease
| Lease Adjusted Debt refers to the total short term and Long term debt of the Company. |
| Lease Adjusted Debt = Short Term Debt + Long Term Debt + Short Term Operating Lease + Long Term Operating Lease |
$233.67 Mn
Lease Adjusted Debt [LAD] (in $ Mn)
30.54%
Change y/y (%)
20.55%
Furniture & Home: Change y/y (%)
- Lease Adjusted Debt: At the end of FY 2020, HVT's lease adjusted debt increased by 30.54% YoY to $233.67 million.
2.7.3Debt to EBITDA Ratio
Measures company's ability to pay off its debt. The Debt to EBITDA ratio indicates as to how long a company would need to operate at its current level to pay off all its debt. EBITDA Ratio = (Short Term Debt + Long Term Debt) EBITDA
| Measures company's ability to pay off its debt. The Debt to EBITDA ratio indicates as to how long a company would need to operate at its current level to pay off all its debt. | |
| EBITDA Ratio = | (Short Term Debt + Long Term Debt) |
| EBITDA | |
0x
Debt to EBITDA (x)
0x
Debt to EBITDA (x) – Last Year
0.99x
Furniture & Home: Debt to EBITDA (x)
| Top Furniture & Home Companies by Debt to EBITDA (x) | HVT | KIRK | WSM | Debt to EBITDA (x) | 0x | 0x | 0.46x |
|---|---|---|---|
| Debt to EBITDA (x) – Last Year | 0x | 0x | 0.48x |
- Comment: HVT had no interest-paying debt outstanding.
- Peer Comparison: Ratio less than its peers' median (1.29x), reflecting that HVT is in a better position to meet its debt repayment obligations on time.
2.8Cash Flow Management
2.8.1Cash Flow From Operating Activities (CFO)
Measures the amount of cash a company generates from its core business activities in a given period to know if it is sufficient enough to fund its operations or if it may require external financing.
| Measures the amount of cash a company generates from its core business activities in a given period to know if it is sufficient enough to fund its operations or if it may require external financing. |
$130.19 Mn
Cash Flow from Operating Activities [CFO]
105.29%
Change y/y (%)
12.51%
Furniture & Home: Change y/y (%)
| Company - CFO |
Furniture & Home - CFO |
|
|---|---|---|
| Annual Growth (%) | 105.3% | 12.5% |
| 3-Year CAGR (%) | 1.8% | 4.25% |
| Quarter Growth (%) | - | - |
| Top Furniture & Home Companies by CFO - CFO (in $ Mn) & Change y/y (%) |
|
|---|---|
| Bed Bath & Beyond Inc. Growth y/y (%) | $1,488Mn 0.03% |
| Bassett Furniture Industries, Inc. Growth y/y (%) | $36.67Mn 273.89% |
| La-Z-Boy Inc. Growth y/y (%) | $164.24Mn 8.95% |
| Top Furniture & Home Companies by % △ in CFO - CFO (in $ Mn) & Change y/y (%) |
|
|---|---|
| Kirkland's, Inc. Growth y/y (%) | $78.56Mn 1050.09% |
| Wayfair Inc. Growth y/y (%) | $1,417Mn 819.82% |
| Tuesday Morning Corp. Growth y/y (%) | $93.87Mn 379.74% |
- Cash Flow From Operating Activities: During FY 2020, HVT's net cash flow from operating activities increased by 105.29% YoY to $130.19 million.
2.8.2Capital Expenditure (CAPEX)
Capital expenditures are funds used by a company to acquire, upgrade, and maintain physical assets such as property, buildings, plant and equipment. Capital Expenditure(CAPEX) = Purchase of Tangibles + Purchase of Intangibles + Capitilized Software Expenses
| Capital expenditures are funds used by a company to acquire, upgrade, and maintain physical assets such as property, buildings, plant and equipment. |
| Capital Expenditure(CAPEX) = Purchase of Tangibles + Purchase of Intangibles + Capitilized Software Expenses |
$10.93 Mn
Capital Expenditure [CAPEX] (in $ Mn)
35.12%
Change y/y (%)
21.16%
Furniture & Home: Change y/y (%)
| Company - CAPEX |
Furniture & Home - CAPEX |
|
|---|---|---|
| Annual Growth (%) | -35.1% | -21.2% |
| 3-Year CAGR (%) | -17.4% | -7.4% |
| Quarter Growth (%) | - | - |
| Top Furniture & Home Companies by CAPEX - CAPEX (in $ Mn) & Change y/y (%) |
|
|---|---|
| Bed Bath & Beyond Inc. Growth y/y (%) | $1,765Mn -31.07% |
| Wayfair Inc. Growth y/y (%) | $334.43Mn -16.58% |
| Floor & Decor Holdings, Inc. Growth y/y (%) | $212.45Mn 8.39% |
| Top Furniture & Home Companies by % △ in CAPEX - CAPEX (in $ Mn) & Change y/y (%) |
|
|---|---|
| Conn's, Inc. Growth y/y (%) | $57.55Mn 75.37% |
| Ethan Allen Interiors Inc. Growth y/y (%) | $15.71Mn 72.25% |
| Rent-A-Center, Inc. Growth y/y (%) | $35.55Mn 68.01% |
- Capital Expenditure: During FY 2020, HVT's capital expenditure decreased by 35.12% YoY to $10.93 million.
2.8.3Dividends Paid
Dividend refers to distribution of Company's earnings to shareholders as a reward for their investment in the company's equity.
| Dividend refers to distribution of Company's earnings to shareholders as a reward for their investment in the company's equity. |
$50.52 Mn
Dividend Paid (in $ Mn)
235.55%
Change y/y (%)
2.37%
Furniture & Home: Change y/y (%)
| Company - Dividend Paid |
Furniture & Home - Dividend Paid |
|
|---|---|---|
| Annual Growth (%) | -235.6% | 2.4% |
| 3-Year CAGR (%) | -20.8% | 3.25% |
| Quarter Growth (%) | - | - |
| Top Furniture & Home Companies by Dividend Paid - Dividend Paid (in $ Mn) & Change y/y (%) |
|
|---|---|
| Williams-Sonoma, Inc. Growth y/y (%) | $150.64Mn -7.35% |
| Rent-A-Center, Inc. Growth y/y (%) | $63.12Mn -360.49% |
| Haverty Furniture Companies, Inc. Growth y/y (%) | $50.52Mn -235.55% |
| Top Furniture & Home Companies by % △ in Dividend Paid - Dividend Paid (in $ Mn) & Change y/y (%) |
|
|---|---|
| Aaron's, Inc. Growth y/y (%) | $0.00Mn 100.00% |
| Pier 1 Imports, Inc. Growth y/y (%) | $0.00Mn 100.00% |
| Ethan Allen Interiors Inc. Growth y/y (%) | $21.47Mn 54.31% |
- Dividends Paid: For the period ended FY 2020, total dividend paid by HVT decreased by 235.55% YoY to $50.52 million.
2.8.4Free Cash Flow (FCF)
Free cash flow (FCF) represents the cash left with the company after it pays for ts operating expenses and capital expenditures and is available for distribution to the shareholders of the Company. FCF = Cash Flow From Operating Activities - Capital Expenditure
| Free cash flow (FCF) represents the cash left with the company after it pays for ts operating expenses and capital expenditures and is available for distribution to the shareholders of the Company. |
| FCF = Cash Flow From Operating Activities - Capital Expenditure |
$119.26 Mn
Free Cash Flow (in $ Mn)
156.05%
Change y/y (%)
38.89%
Furniture & Home: Change y/y (%)
| Company - Free Cash Flow |
Furniture & Home - Free Cash Flow |
|
|---|---|---|
| Annual Growth (%) | 156.1% | 38.9% |
| 3-Year CAGR (%) | 15.6% | 8.8% |
| Quarter Growth (%) | - | - |
| Top Furniture & Home Companies by Free Cash Flow - Free Cash Flow (in $ Mn) & Change y/y (%) |
|
|---|---|
| Bed Bath & Beyond Inc. Growth y/y (%) | $2,467Mn 18.72% |
| Wayfair Inc. Growth y/y (%) | $1,082Mn 281.08% |
| Williams-Sonoma, Inc. Growth y/y (%) | $421.02Mn 6.35% |
| Top Furniture & Home Companies by % △ in Free Cash Flow - Free Cash Flow (in $ Mn) & Change y/y (%) |
|
|---|---|
| Tuesday Morning Corp. Growth y/y (%) | $78.05Mn 2320.75% |
| Floor & Decor Holdings, Inc. Growth y/y (%) | $193.72Mn 2139.49% |
| Bassett Furniture Industries, Inc. Growth y/y (%) | $30.65Mn 505.05% |
- Free Cash Flow: During FY 2020, HVT's free cash flow increased by 156.05% YoY to $119.26 million.
2.8.5Free Cash Flow per Store
Free Cash Flow Per Store = FCF No. of Stores
| Free Cash Flow Per Store = | FCF |
| No. of Stores |
$0.99 Mn
Free Cash Flow [FCFF] per Store
158.19%
Change y/y (%)
59.06%
Furniture & Home: Change y/y (%)
| Company - FCFF per Store |
Furniture & Home - FCFF per Store |
|
|---|---|---|
| Annual Growth (%) | 158.2% | 59.1% |
| 3-Year CAGR (%) | 26% | 1.4% |
| Quarter Growth (%) | - | - |
| Top Furniture & Home Companies by FCFF per store - FCFF per Store (in $ Mn) & Change y/y (%) |
|
|---|---|
| RH Growth y/y (%) | $2.96Mn 55.32% |
| At Home Group Inc. Growth y/y (%) | $1.60Mn 340.33% |
| Floor & Decor Holdings, Inc. Growth y/y (%) | $1.46Mn 1920.59% |
| Top Furniture & Home Companies by % △ in FCFF per store - FCFF per Store (in $ Mn) & Change y/y (%) |
|
|---|---|
| Tuesday Morning Corp. Growth y/y (%) | $0.11Mn 2423.23% |
| Floor & Decor Holdings, Inc. Growth y/y (%) | $1.46Mn 1920.59% |
| Bassett Furniture Industries, Inc. Growth y/y (%) | $0.49Mn 550.05% |
- Free Cash Flow per Store: During FY 2020, HVT's free cash flow per store increased by 158.19% YoY to $0.99 million.
- Peer Comparison: Its free cash flow per store was greater than its peers' median ($0.26 million).
2.8.6Free Cash Flow per Square Feet
Free Cash Flow Per Square Feet = FCF Gross SQFT
| Free Cash Flow Per Square Feet = | FCF |
| Gross SQFT |
$27.4
Free Cash Flow [FCFF] per Sq. Ft.
160.41%
Change y/y (%)
56.35%
Furniture & Home: Change y/y (%)
| Company - FCFF per Sq. Ft. |
Furniture & Home - FCFF per Sq. Ft. |
|
|---|---|---|
| Annual Growth (%) | 160.4% | 56.4% |
| 3-Year CAGR (%) | 16.2% | 11.7% |
| Quarter Growth (%) | - | - |
| Top Furniture & Home Companies by FCFF per Sq. Ft. - FCFF per Sq. Ft. (in $) & Change y/y (%) |
|
|---|---|
| RH Growth y/y (%) | $225.50 49.90% |
| Sleep Number Corp. Growth y/y (%) | $136.54 83.81% |
| Williams-Sonoma, Inc. Growth y/y (%) | $101.97 5.73% |
| Top Furniture & Home Companies by % △ in FCFF per Sq. Ft. - FCFF per Sq. Ft. (in $) & Change y/y (%) |
|
|---|---|
| Tuesday Morning Corp. Growth y/y (%) | $9.19 2390.86% |
| Floor & Decor Holdings, Inc. Growth y/y (%) | $18.67 1868.78% |
| Kirkland's, Inc. Growth y/y (%) | $23.44 436.45% |
- Free Cash Flow per Square Feet: During FY 2020, HVT's free cash flow per square feet increased by 160.41% YoY to $27.4.
- Peer Comparison: Its free cash flow per square feet was greater than its peers median' ($17.9).
2.8.7Free Cash Flow to Dividend (X)
2.36x
Free Cash Flow [FCFF] to Dividend (x)
3.09x
FCFF to Dividend (x)– Last Year
-1.54x
Furniture & Home: FCFF to Dividend (x)
| Top Furniture & Home Companies by Free Cash Flow to Dividend (x) | BBBY | BSET | LZB | FCFF to Dividend (x) | 3826.29x | 6.74x | 4.71x |
|---|---|---|---|
| FCFF to Dividend (x) – Last Year | 3909.97x | 0x | 4.35x |